The Hybrid Technologies Digital Database (HTDD, also base de datos digital de las tecnologías migrantes, in Spanish), is a work in progress led by Dr. Lindsay Smith at the Border Laboratory. We are a group of researchers primarily based in Phoenix, Arizona, a city within the Salt River Valley and situated in the Sonoran Desert about 120 miles north of the border that separates the U.S. from Mexico. While we were spatially situated in the desert borderlands, because of the pandemic, we were materially isolated from the border on the ground. Paradoxically, we were forced to reproduce the border virtually in order to map and visualize it. Yet, our modes of knowing the lifeways we seek to understand only sharpened as we transitioned to a virtual format. We turn to the internet to conceive of the multilayers of technology, institutions and people. The “field” in this digital register offers new possibilities for ethnography that disrupt time (Keeling 2005) and space (Jackson 2012) while offering a framework to contextualize data grounded in local experiences. To reach the linguistic, geographic and political borderlands, we invented a strategy to “map” it. Taking a collective spreadsheet as our anchor point we mobilize and facilitate three modes of digital story: 1) mapping (online dataset), interweaving (webinar) and narrating (interviews) all of which opened up possibilities for generating questions and answers meaningful to humanitarian groups in the field. We propose building an ethnographic database in/ with/ for the U.S. Mexico borderlands. In which ways can the HTDD be generative and tailored to the needs of people and groups already working in the Borderlands?
FILE CARD
Field device: Hybrid Technologies Digital Database in the Mexican Borderlands (HTDD) / Base de datos digital de las tecnologías migrantes.
Mode of inquiry: Mapping Technology for story-mapping, telling, narrating
Geographical locations: US-Mexico Borderlands: Mexico, Guatemala, U.S.
Duration/time: 2019 – ongoing (4 years)
Ethnographic Collaborators: experts, activists, professors, graduate and postdoctoral students
Resources: 1) Story mapping, 2) story interweaving: educational webinars across communities of scholars, activists, and advocates, 3) story narrating: interviews / recruitment
Degree of difficulty: medium (need access to physical computer and software like google, spreadsheets, arcGIS)
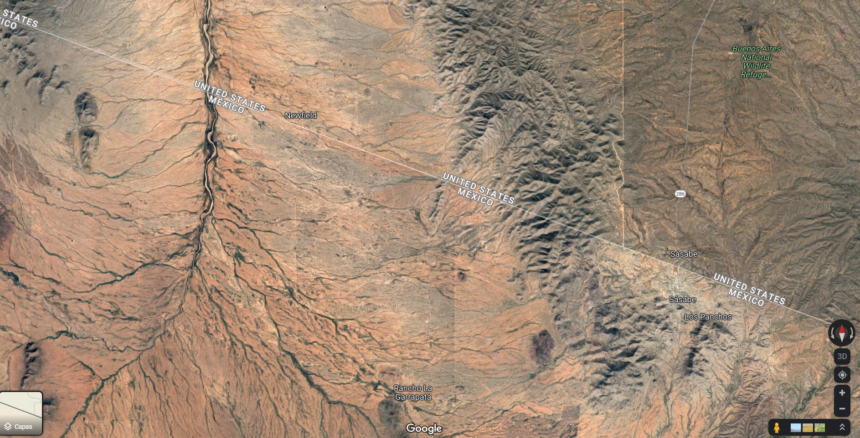
Figure 1. US-Mexican border on Google Earth (2023)
Hybrid Technologies Digital Database in the Mexican Borderlands
We approach the borderlands as both a geographical space of practice and a generative analytical frame for exploration of migrant technologies. We are focused on technologies that are used in both humanitarian and human rights and in security/surveillance spaces. We also change our focus from the US-Mexico to the Mexican borderlands, centering Mexico and its border. Despite being spatially near, in the border state of Arizona, we were materially far from the desert grounds that witnessed countless migrations detaching us from the realities migrants face within the rigid geopolitical structures that manage these flows. While there has been a lot written about emerging methods to maneuver around the obstacles of the pandemic (i.e. online ethnography, digital ethnography, and patchwork ethnography Günel et al. 2020), little focuses on the paradoxes of being in the desert yet isolated/insulated from within.
These were out of reach for us (as researchers) and many during a global pandemic, forcing us to perceive different dimensions of proximity for the formation of our ethnographic approach. In doing that, we reproduce the border virtually in order to map it. The “field” here is a shared digital database composed of actors, technologies and institutions which connect within and across the US-Mexico Borderlands and produce material relationships and narratives. We explicitly invoke the “Borderlands” (Anzaldua 1987) to problematize the meeting of the United States and Mexico to foreground the multidimensional interconnected bordering dimensions in those lands. We want to emphasize the foundational place where our idea of this field device emerges: migrants advocates who are in the midst of precarity and organize around local community concerns and innovate knowledge and technology.
While we acknowledge the realities of exploitation, displacement and violence in the borderlands, we re-situate (ourselves through) this virtual field device, a collective spreadsheet, and conceptually (re)imagine the U.S. / Mexico borderlands as a space for knowledge exchange between scholars, advocates and civil society, and coalition building for migrant justice. These realities that intertwine artifacts, institutions and lives are difficult to capture in schematic categories and we don’t mean to reduce them as such. In fact, we hope to use this as a tool where the dimensions of data collection, mapping and storytelling can help scholars and advocates to visualize and embody new complex and meaningful connections.
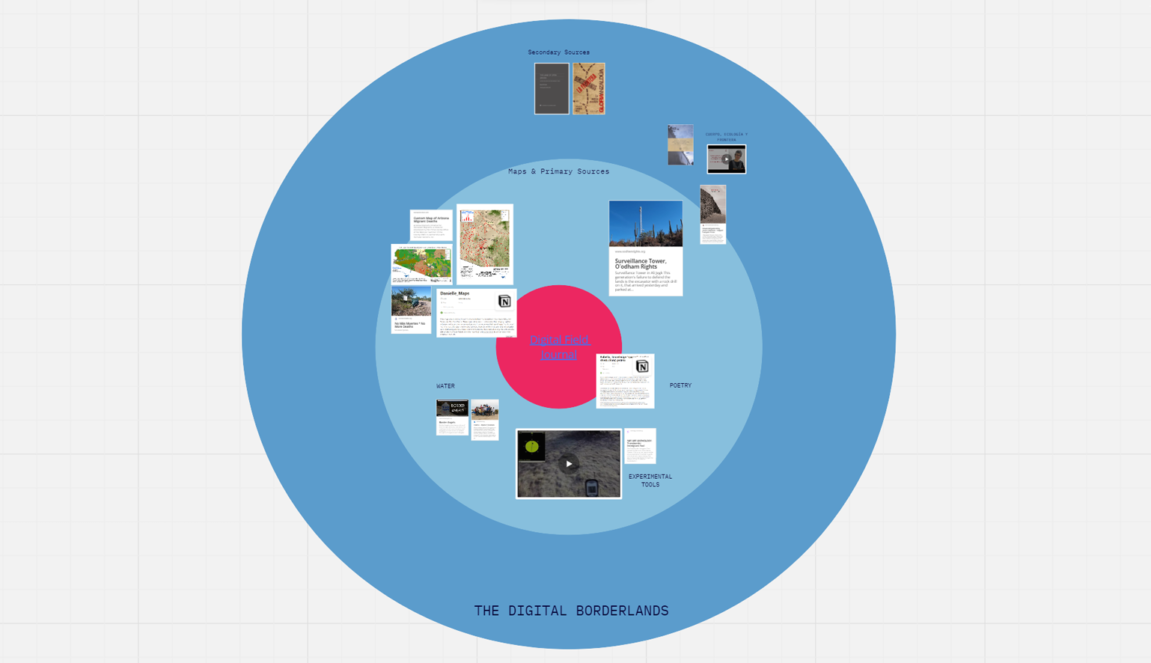
The field device we compose is a digital database that we optimized as a preliminary first step in our fieldwork in the borderlands for two purposes: First, to curated it as a visual mapping tool to spatialize migrant technologies on the border; and second, to engage with it as a method of patchwork ethnography (Günel et al. 2020). As a tool for human rights and migrant advocacy, this dataset is meant to be used as a repository of contact and overview information of people, institutions and technology; as method to open new modes of relationality and collaboration between borderland scholars, advocates and (organized) civil society; and as a bilingual narrative/writing technology (King 1994) to practice collective situated storytelling (Haraway 1989). See Figure 2 for a reference.
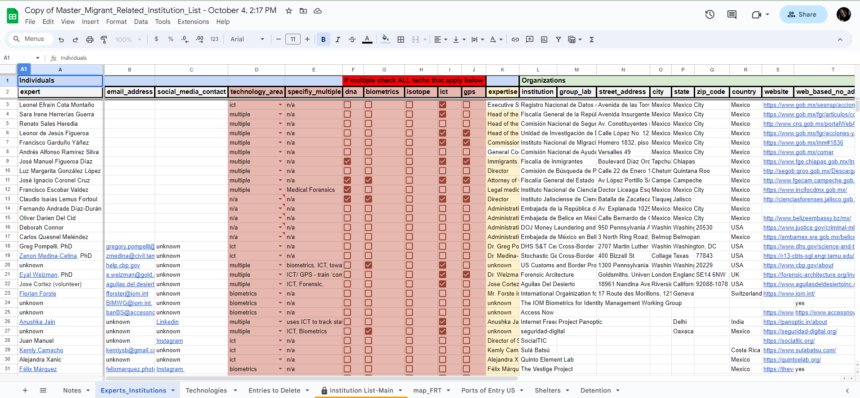
Figure 2. Example dataset organized on a Google Sheets which served as our “Master” spreadsheet
Synthesis of Field Device
The HTDD uses image and video collections (using Zoom and Youtube) and data technologies (including Google spreadsheet, Notion, and Miró) to map, narrate and tell stories about migrant technologies. To ensure the data corresponds across these platforms, there are categorical schemes and design elements to have in consideration.
The HTDD was designed in such a way that it could be read by a mapping and analytical software called ArcGIS. We selected this program because it enabled us to visualize and analyze large amounts of spatial information in a dynamic, digital environment. It also provides tools for integrating, querying, and analyzing a wide variety of data types, such as scientific and cultural data, satellite imagery, and aerial photography–as well as the data collected from our digital fields–into projects, with corresponding geographic locations. In this context, the spreadsheet serves as an interface between our data and ArcGIS so that we could produce story maps –which can include maps, narrative text and other multimedia content– for a wider audience.
ArcGIS enables us to use other sources of readily available geodatasets to add layers—geographical data—to our map contents where new connections emerge across diverse geographical scales and temporalities Through these new connections we hope to render dense, complex and stratified stories. Most importantly, we seek ways to make this tool useful and bring our work into modes of collective action and solidarity-building especially in the context of migrant justice.
With categorical schemes we build spreadsheets to populate with qualitative data the core of the HTDD. We led by casting a wide net to building subsets of information organized by four focus technologies: DNA, Isotope analysis, biometrics, ICT & GPS. We combined our data into what we call “The Experts & Institutional Affiliations List” which contains a central space to collect all the information, contrast and combined list of experts, companies, programs and institutions: government, ngos, academic, and industry across the borderland throughout Guatemala, Mexico and the US. Experts are added based on their affiliation to the institution. We define “expert” as a broad category ranging from those with lay knowledge to those with specialized expertise.
In addition, the database is organized into five main categories that orient the different dimensions for each search. Those categories are : “Individuals”, “Organizations”, “Technology”, “Analysis”, “Lab Annotation”. The information collected on “Individuals” is their contact information, the area of expertise and technology they are affiliated with. “Organizations” consists of all geographical coordinates for mapping as well as the information on institutional focus and the type of institution it is. Technology will be a description of the particular five technologies we are working on in the lab. Analysis categories include the role of the expert as with a “creator”, “implementer”, “experimenter”, “critic”, “regulator” or “hacker”. Finally, our “lab annotations”, which are internal, are where we decide on who to prioritize for interviews or talks as well as put our concerns.
Design elements play an important role in the construction of the story map. Our lab found that the best way to map experts, institutions and technologies was to begin with people first. For example, a major focus in summer 2020 was to center migrant rights leaders from which we began a broad google search “migrant rights groups” with regional focuses across the borderlands identifying most prominent groups. Through this process, we became aware of the depth of these networks as the database grew. This was important for identifying key actors that we could begin to interview and collaborate with.
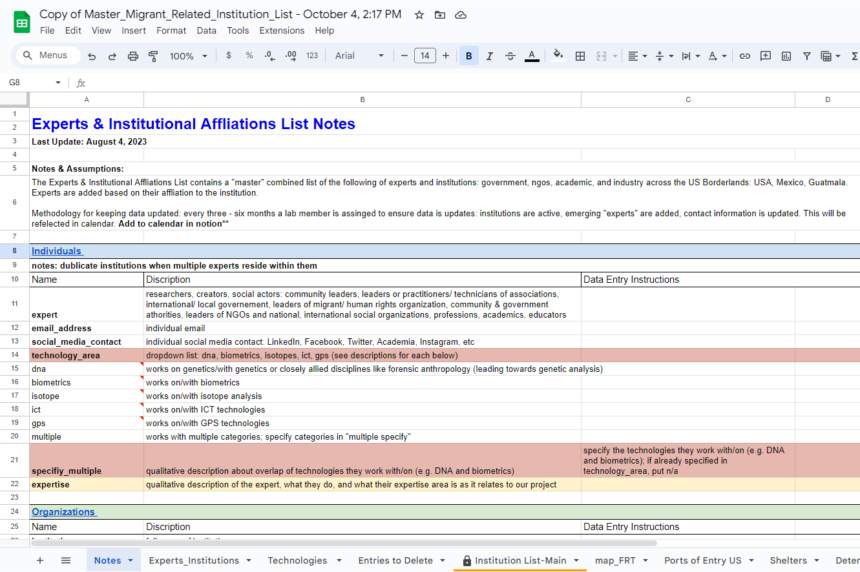
Figure 3. Notes and Assumptions Tab which served as a guide to navigate our “Master” spreadsheet
As we collected data for the HTDD, we divided the work by technology. Initially the bulk of work was carried out through a literature review. Our collective work presented useful information about the connections among the varying approaches we each developed to collect and enter data into the database. Depending on the social and epistemic communities involved in the use of those technologies in the Borderlands we began to categorize our data. This strategy helped us narrow our focus on a set of case studies that drew attention to technology in place (Seth 2009). Below is a list of technologies that we focused on as well as the approaches we took.
Isotope Analysis: Forensic Isotope Analysis (FIsA) is an emergent implementation of a technology used to track animal movement and archeological dating. We identified key actors and organizations through scholarly online searching. We then began to register the history of the technology through conferences and publications, but also their relationships with government agencies. The articles were divided in two working categories: 1) isotope analysis for humanitarian, or 2) security efforts. The reason why we took into account articles and research papers was because the technology for forensic purposes is relatively new, and has been controversial due to an alleged lack of accuracy. Nevertheless, after 2009 and through the integration with GIS, the technology has gained trust, shown by scholarly production and through the private/business efforts of some researchers and labs.
Information and communications technology (ICT) and GIS: ICT and GIS technologies convey ground and remote sensors, telecommunication and vigilance towers, satellite image, drones, small probes and other methods for remote sensing based on an information center. Initially, we looked for relevant news and scholarly sources related to sensors, mapping, social media, apps and smartphones, in relation to the Mexican Borderlands. Based on these sources, we collected information in the spreadsheet.
Originally developed by the military, most of these technologies are deployed and used by governments, but also telecommunication and mapping technologies have been reappropriated by migrants, organized civil society and advocates to provide critical information during their migration —eg. some apps intended to map relevant infrastructures for migrants survival—, or to help to locate the ones who disappeared —eg. the use of geospatial technologies applied to forensics to locate human remains and clandestine graves—. The complexity of this context made us conflate ICT with GPS, highlighting the hybrid nature of these migrant technologies used both by migrants, security and organizations.
Biometrics: Biometrics refer to a set of techniques to identify unique physical and behavioral characteristics of an individual. The most common are fingerprints, facial, voice, iris, and palm or finger vein patterns. We performed a literature review by selecting sources from the following: Publications & Journals; Internet searches (i.e., Google, Google Scholar): used keywords “biometrics”, “migration” , “technology”, border management”, “Alphonse Bertillon” and found journal articles, books, secondary and primary sources, gray literature (news, op-ed, press release), and government reports, as well as professional societies and networks: IEEE, IAPR Technical Committee on Biometrics; STS Projects: critical frameworks mostly in Europe and South India. We organized these sources in a shared folder on google drive.
After narrowing our search to focus on specific empirical examples, we did preliminary research on the tech company Trust Stamp and their technology “Trust Stamp (EgHash™)” and “followed” its commercial development through press releases, conferences, and news articles. The technology is currently a pilot study, so much of the information isn’t current (dates on reports range from June 2018 – 2020).
DNA: DNA technologies involve a culturally, geographically and historically situated set of techniques and artifacts which have served different purposes: from surveillance to genomics and biomedical research, from criminal forensics to humanitarian identification. At the Border Laboratory, our aim is to understand the multidimensional relationships of DNA technologies, forensic science and activism in the context of the humanitarian crisis in Mexico. These relationships led us first to the US-Mexico border, and specifically to Ciudad Juárez-El Paso, where we identified a starting point for imagining an alternative history of Forensic DNA as intersecting with security, migration, and human rights activism in the broader context of the Mexican borderlands. To this end, we have conducted interviews and collective online conversations —such as webinars or zoom meetings— with groups of Buscadoras (women who are searching for their disappeared family members), legal activists, and humanitarian scientists working in that context, collecting stories and data for mapping and storytelling, as well as generating fruitful connections between advocates, civil society and border scholars.
Digital Fields and Notes Online
A central part of the practice of ethnography is taking field notes. We wanted to experiment with the process in this virtual capacity. Similar to how anthropologists record observations in the physical field, we approached the webpages of institutions and actors and identified border discourses in mission statements, cultural representations (i.e., poems, prose and other creative outputs), testimonies, mixed media, technological prototypes, and anything that gave us a sense of the social worlds that technologies, people and borders occupy in the media venues they represented and then we recorded them as digital Fieldnotes as entries into another platform called Notion.
Figure 4.1. Notion, “Field Notes”
In Notion, we collected field observations in the format of a calendar and linked these entries in the Mastersheet Data Progress Journal / Calendar (see Figure 3). The daily field note entries entailed the observations from the data we were entering into the HTDD. These digital tools together offered a platform for us to understand the conceptual border from our pandemic enclosures.
Figure 4.2. Notion, “Mastersheet Data Progress Journal”
In addition to Notion, Miro is a digital collaboration platform that we used to facilitate remote and distributed communication and collaborate in the creation of visual and conceptual maps. Repository of the poems, literature, art practice, our field notes and organizational and tactical tools used for migrant survival (see Figure 4). Unlike ArcGIS which is an analytical tool, Miro enabled us to work in a more artistic and aesthetic way. It enabled us to start to conceptualize our artistic project called, Fractured Borderlands, which we presented for 2022 4S Making and Doing in Cholula, MX.

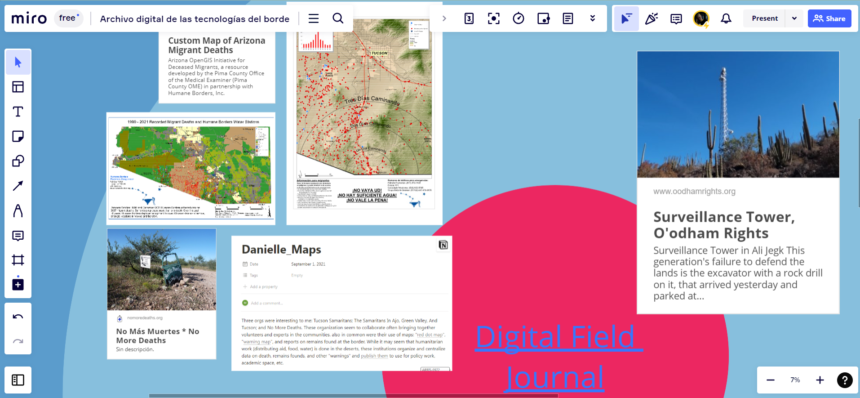
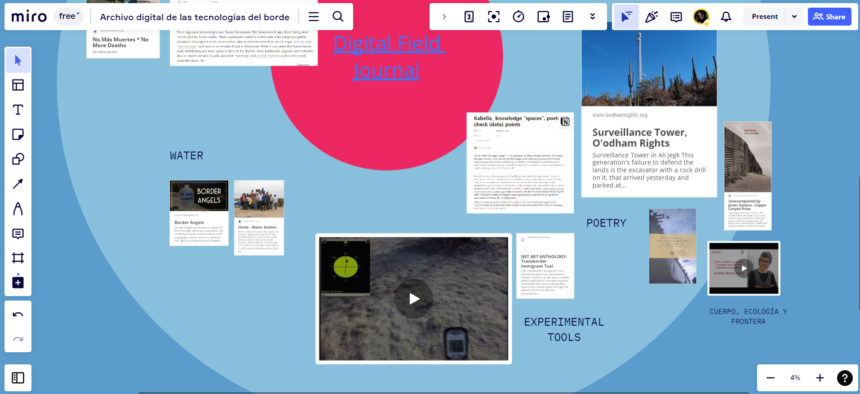
Figure 5. Miro, “Archivo Digital de las Tecnologías del Borde”
Possibilities for Ethnographic Inquiry
Taking a collective spreadsheet/database as our anchor point we mobilize and facilitate three modes of digital story(telling): 1) mapping (database), narrating (interviews), and interweaving (webinar), all of which opened up possibilities for generating questions and answers conceivably tailored to humanitarian groups around migrant technologies.
Story Mapping. We found that the field device helps us generate not only data, but it helps us map stories. Since our research engaged with activist ingenuity of these technologies, we found that mapping the borders is a work on movement, due the nature of the migration technologies. The remoteness that migrants live, and the transient dimensions that those technologies trace have multiple technical, human and political nuances that make this mapping a process of tracking down the tracers, in the case, mapping the technologies, a process of collective mobilization.
Previously, ethnographers have proposed such methods as “hashtag ethnography” or “hashtag activism” (Bonilla and Rosa, 2015) to think of sites of engagement beyond physical proximity to virtual worlds (Boellstorff, 2020) where social society is reflected in social media. Moving from this landscape orientation to segmented data, you run a risk of erasure. To partially mediate these blind spots, we discovered our talents across ethnographers who are situated in the borderlands in Mexico City (MX) and Arizona (USA), which decenteres our headquarters in Tempe, Arizona, where our lab was founded at Arizona State University under the direction of Dr. Lindsay Smith.
The processes of story mapping helped to “embed” and orient ourselves while locating institutional and subject formations taking place in the borderlands which we are articulating through practices of hacking and appropriating technologies of surveillance for humanitarian use emerging organically from, for example, Mijente’s campaign, “#NoTechForICE” and #SeguridadDigital. #NoTechForICE is a campaign that exposes tech’s role in criminal justice and immigration enforcement. It offers people ways to take direct action to confront corporate actors, organizing with tech workers and students to leverage their influence over Silicon Valley, demanding companies to disinvest. The visual representation of the map helps to prioritize and move certain actions forward. We initiated contact with several prominent experts and advocates who we located within our network or had existing contact with to invite them to participate in a speaker series and some for an interview, like Ivonne Orozco a teacher-activist who gave a talk entitled “Teach In, Speak Out: Teachers Against Child Detention.” Here a story is crafted along those who are already engaged in this work from a place that is locally experienced or as advocates for justice. This is a work in progress and our interactive map is forthcoming.
Story Listening & Narrating. The database was an optimal recruitment strategy for interviews as we identified the potential for advocates and experts to narrate and tell their own stories. This practice opened us up to additional interviews and meaningful collaborations. The interviews allow us to learn more about researchers and activists as people situated in places and times who have encounters with these technologies in contexts of scientific curiosity, conviction and interest, as well as pressing need for forensic implementation. The qualitative data provides new insights and links between the dots of our mapping, but more importantly, we learn the temporal succession of events and gain knowledge about the roles of people in these organizations.
We decided to conduct a set of exploratory interviews/conversations based on our previous knowledge in the field. These interviews have allowed us to identify relevant actors in place and time, understanding the specific context in which people and institutions interact with technology. Regarding these interviews, we aim:
- To contextualize: Qualitatively inform the data contained in the database and draw new Spatio-temporal connections in it, helping us map stories.
- To map: Identify new actors and conduct focused and structured interviews on particular key actors.
- To produce embodied knowledges: Connect with actors and places in a situated, embodied way, identifying the relevant issues, needs, and constraints these actors deal with, and developing meaningful modes of collaboration and mobility of meanings.
Story Sharing and Interweaving. The device came to function as our tool in building a community of scholars, migrants and activists to optimize storytelling of migrant experiences. Fall 2021, building on our own networks and from those found searching across activist websites, we compiled a “contact list” prioritizing experts that we wanted to invite onto our digital speaker series. We invited 9 activists, scholars, and advocates involved with border technology to some extent. This came together as a digital speaker series entitled, “Data, Practices, and Stories” where foregrounded activists, migrants, and researchers in Central America, Mexico, and the United States who are cultivating alternative technological worlds in the Mexican Borderlands.
Using Genetics, Chemistry, GPS, Internet Communication Technologies (ICT), and biometrics, our speakers shared their experience living and working with migrant communities and their technologies. We invited speakers researching, creating, hacking, and reworking humanitarian technologies in the US, Mexico, and Guatemala. We also invited wider audiences to a series of conversations about emergent spaces of resistance and innovation that seek to enable more just technological futures in the Mexican Borderlands.
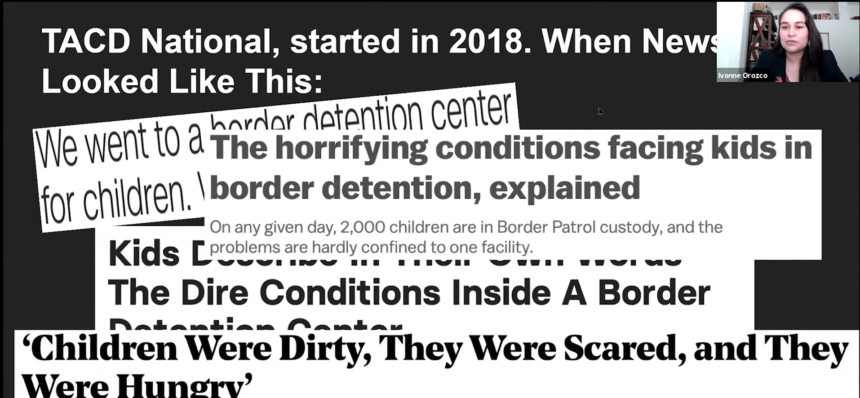
Figure 6. Activist Ivonne Orozco during her presentation at the 2022 Speaker Series “Data, Practices, and Stories”.
Flipping the HTDD: User-led Navigation
Data Collection & Curation of GoogleSheets was carried out over multiple phases, and in current development. The process showed how hard it was to categorize people’s social experiences for technical outputs and we found that through deliberation we needed new strategies to optimize the spreadsheet. This involved recategorizing and reorganizing the spreadsheet. As the social often is in tension with categorical schemes, creating a space for the social to be expressed is important. This is why ethnographic field notes are important. But we still were left wondering how our data could be experienced by others.
While retooling the HTDD, we developed the first iteration of our multimedia installation presented and awarded in 2022 at the annual conference of the Society for the Social Studies of Science, in Cholula Mexico. Participants were invited to engage with the installation in several ways. If they chose to sit in front of the screen and listen via headphones, they were greeted with a collage of moving images whose degree of superimposition they could control via the jaguar-headed knobs in front of them. One layer of images was composed of video fragments of borderland landscapes recorded by research team members during fieldwork. Another layer juxtaposed video clips from lectures, advertisements, and journalism featuring representations of four different border technologies: forensic DNA analysis, isotope analysis, geospatial and ‘big’ data, and biometric analysis. The position and relative transparency of the expert ‘talking heads’ were directly controllable by the installation participant. What the participant heard was also under their influence: either the audio from the border tech-related video clips or a sort of ‘directors commentary’ in which members of the research team interviewed each other, reflecting on the process of constructing the Hybrid Technologies Digital Database (HTDD) and transmuting it into the installation. Throughout, the experience was underscored with music composed by team member Octavio Muciño Hernandez, drawing on motifs from Mexican popular music traditions. The participant was seated in such a way that their own face was always, but barely, visible in reflection on the screen. Elsewhere in the installation, discrete items from the HTDD, such as locations, names, classifications, and dates, were represented on small magnetic strips, which participants were invited to make meaning of through new spatial and conceptual arrangements (see Figure 8).
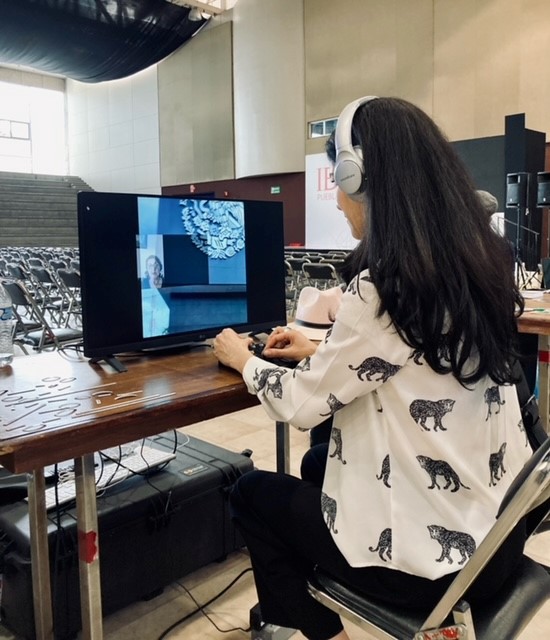
Figure 7. A 4S conference goer controlling the jaguar-headed knobs to view layers of images, video fragments and borderland landscapes while listening to audio clips and music.
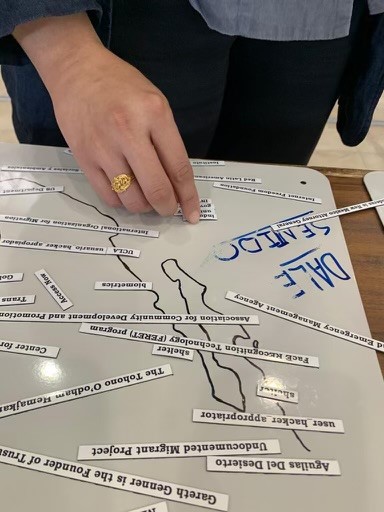
Figure 8. Small magnetic strips with discrete items from the HTDD, such as locations, names, classifications, and dates for interactive meaning.
The composite “field” which formed the basis for the exhibit combined created and collected media, data representations and categorical classifications inscribed by the research team, and intra-research team interviews reflecting on the process of distributed, uneven, and politicized data collection and sense-making. The goal of the installation was to bring together the Hybrid Technologies Digital Database and interpretive field journal in a multi-sensory border laboratory encounter, to invite participants to engage with borderlands technologies in ways open to appropriation, hacking, and reinterpretation. We plan to turn the installation into an open source platform that will be added to our website to reach broader and accessible audiences.
SOURCES
AbuJarour, S., Ajjan, H., Fedorowicz, J., & Köster, A. (2021). ICT Support for Refugees and Undocumented Immigrants. Communications of the Association for Information Systems, 48(1), 40.
Beltrán, H., 2020. The first Latina hackathon: Re-coding infrastructures from México. Catalyst: Feminism, Theory, Technoscience, 6(2), pp.1A-1A.
Boellstorff, T., 2020. Rethinking digital anthropology (pp. 39-60). Routledge.
Bonilla, Y. and Rosa, J., 2015. #Ferguson: Digital protest, hashtag ethnography, and the racial politics of social media in the United States. American ethnologist, 42(1), pp.4-17.
Fortun, K., Fortun, M., Okune, A.H.S.C., Schütz, T. and Su, S.Y., 2021, July. Civic Community Archiving with the Platform for Experimental Collaborative Ethnography: Double Binds and Design Challenges. In International Conference on Human-Computer Interaction (pp. 36-55). Springer, Cham.
Jackson Jr, J.L., 2012. Ethnography is, ethnography ain’t. Cultural Anthropology, 27(3), pp.480-497.
Keeling, K., 2005. Passing for human: Bamboozled and digital humanism. Women & Performance: A Journal of Feminist Theory, 15(1), pp.237-250.
Okune, A.C., 2020. Open ethnographic archiving as feminist, decolonizing practice. Catalyst: Feminism, Theory, Technoscience, 6(2).
Seth, S., 2009. Putting knowledge in its place: science, colonialism, and the postcolonial. Postcolonial studies, 12(4), pp.373-388.